Microstructural Analysis
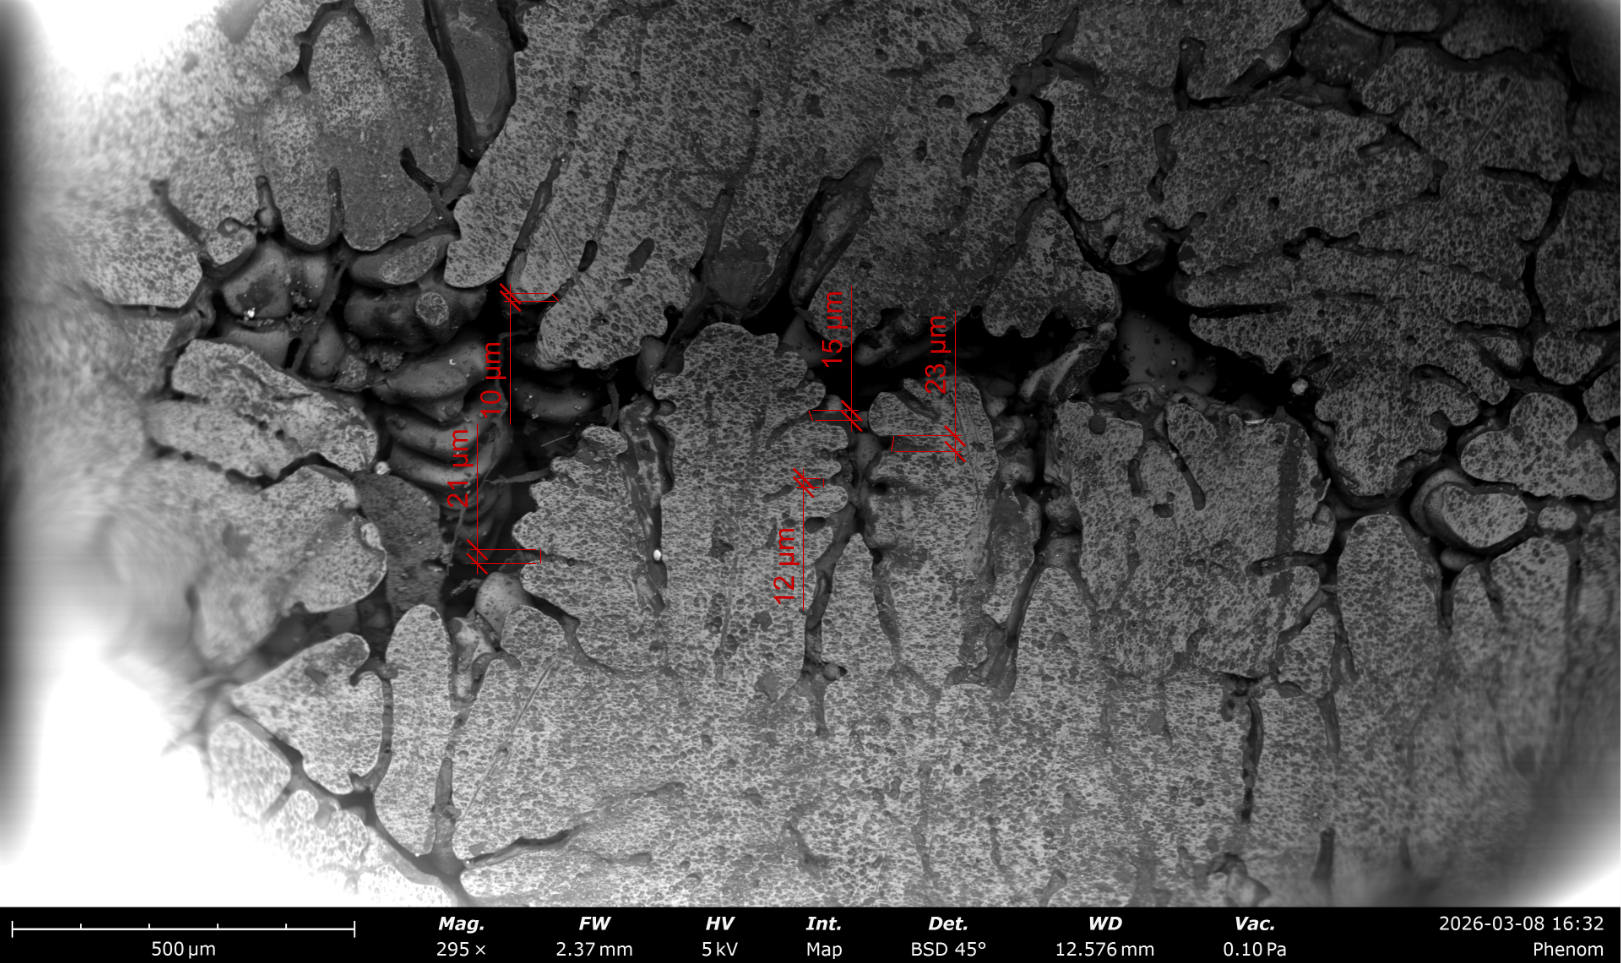
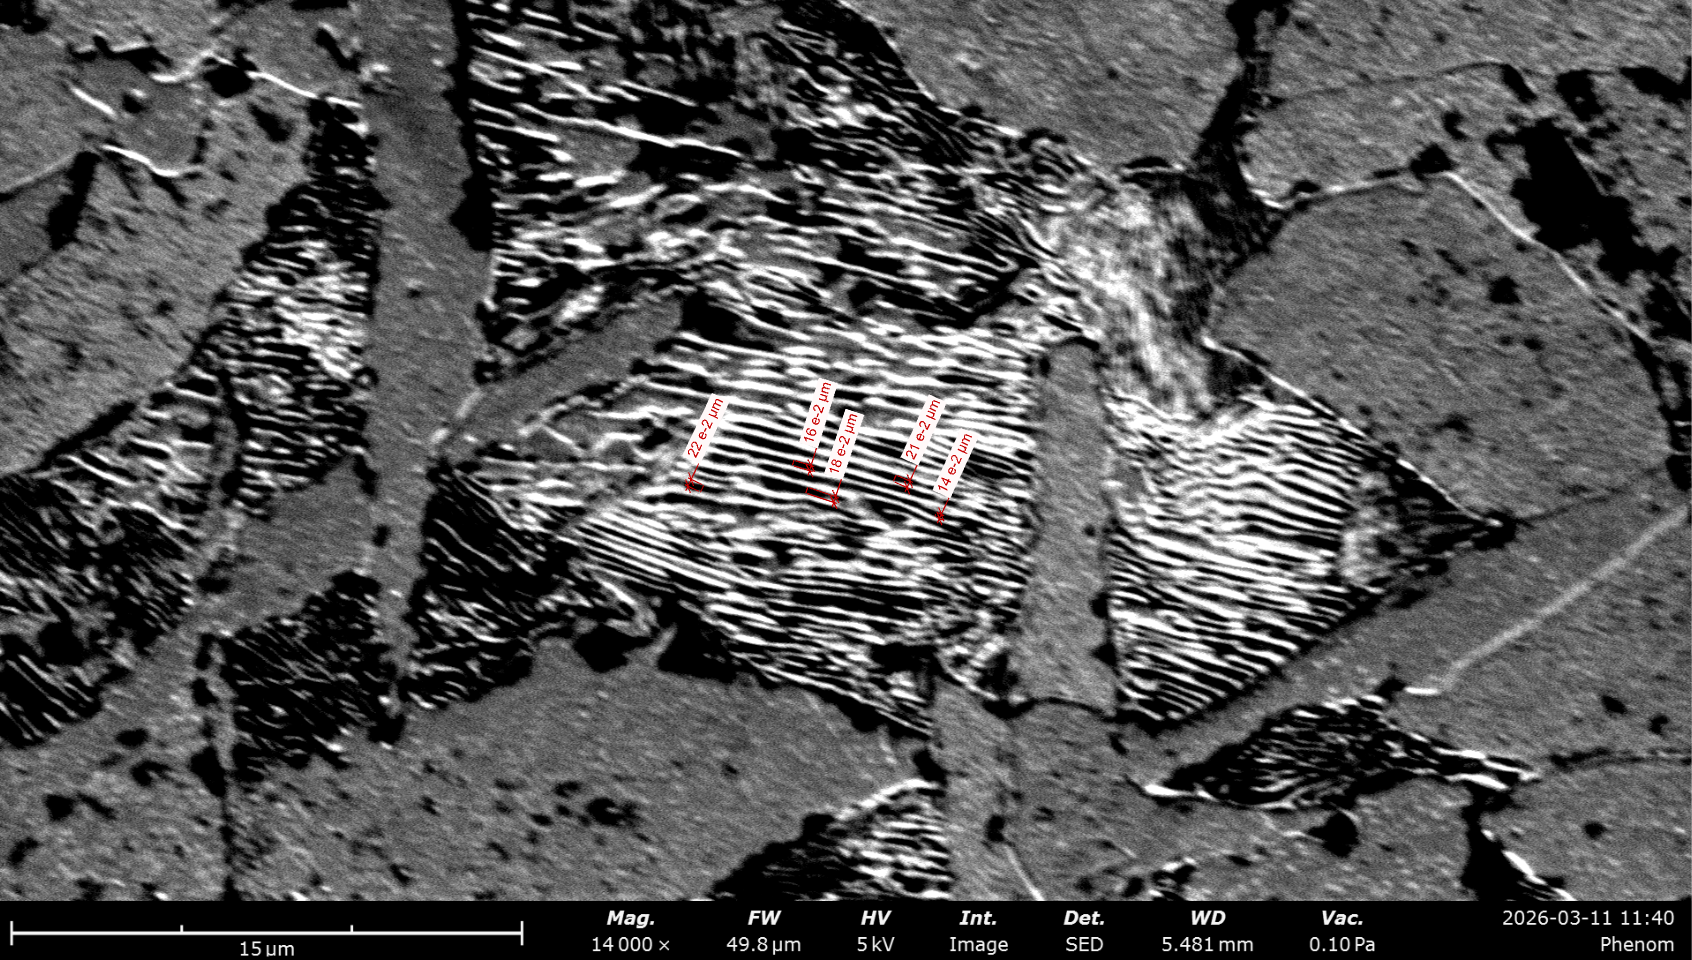
I like applying tools, software, and skills across fields. It comes in really handy, and I’m always surprised by the applications I find. I was analyzing polished titanium specimens under the optical microscope and trying to determine which one was annealed based on average grain size. I was calculating grain size using the Jeffries planimetric method, which requires mapping a circle of known diameter onto a micrograph, and counting the number of grains contained by the circle and the number intersected.
Rhino is an industry CAD software for architecture, but I have found that it lends itself surprisingly well to scaled data analysis. I’ve since used it with various micrographs, as seen below.
Titanium Samples
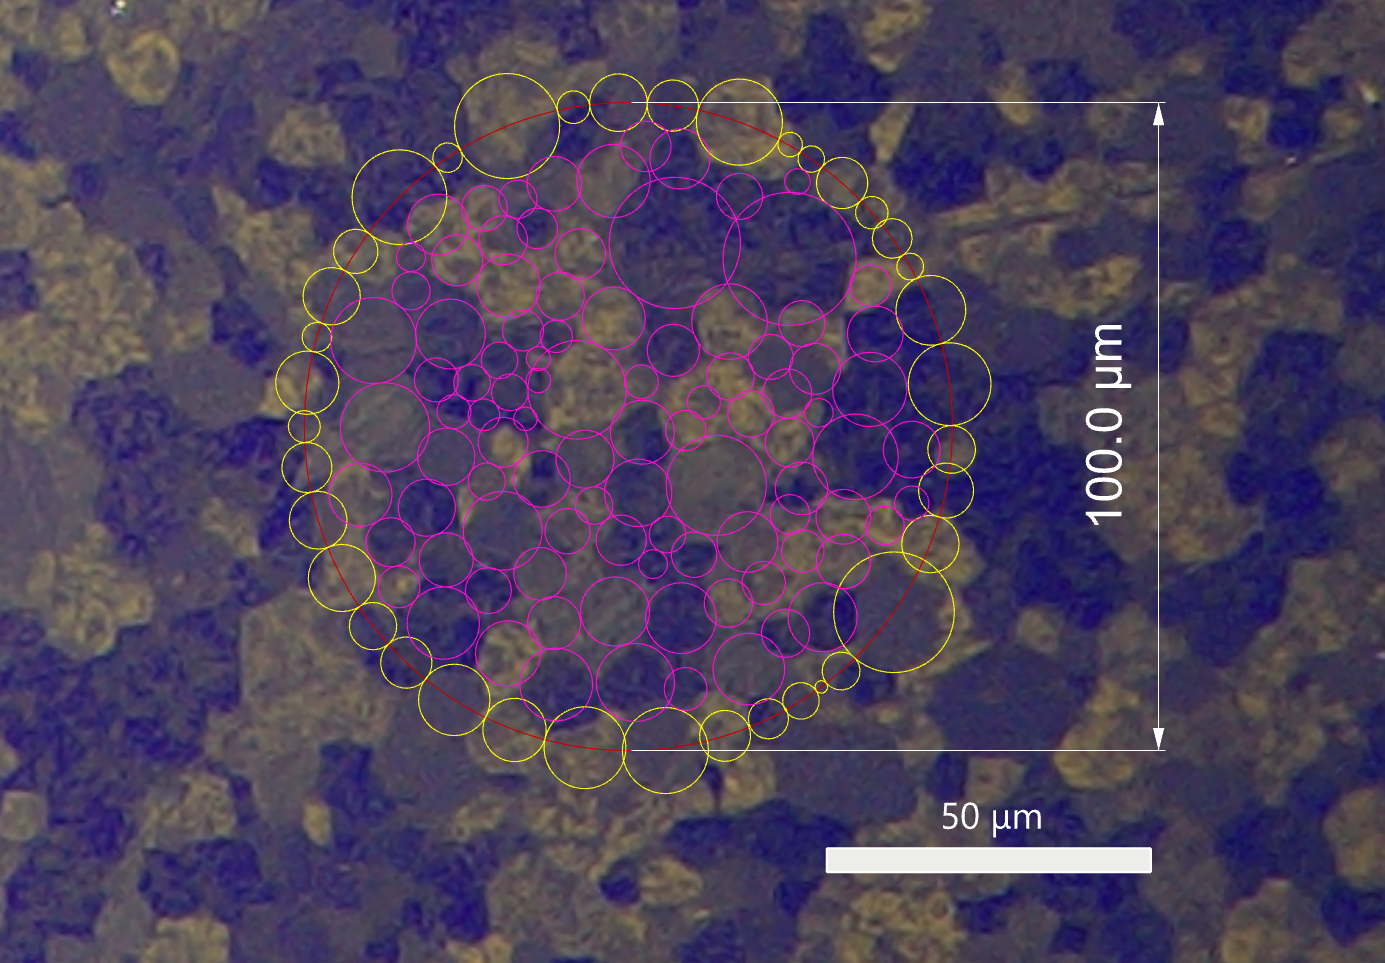
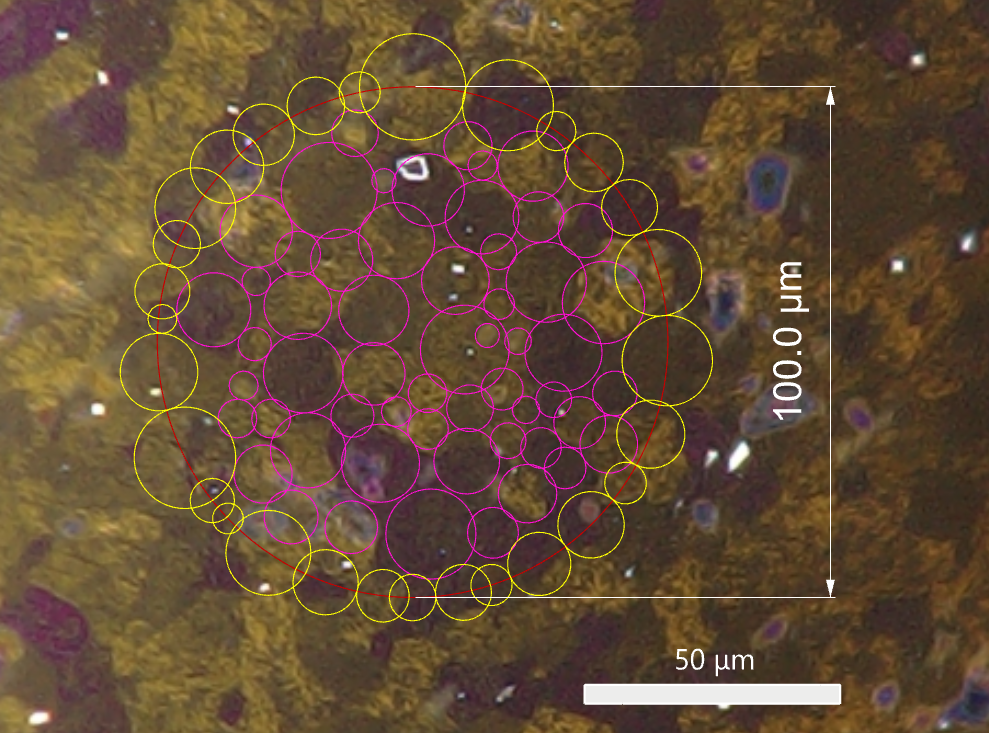
For Sample A, a 100 micron circle intercepts 38 grains, and encloses 96 grains, leading to an average grain size of 9.33 microns. For Sample B, a 100 micron circle intercepts 29 grains and encloses 56 grains, leading to an average grain size of 11.91 microns. CP Ti B has larger grains than CP Ti A. This suggests that CP Ti B was annealed because the annealing process often results in larger and coarser grains as dislocations annihilate.